
Turbulence Ahead: Market Review and Outlook
Market Review and Outlook
Near-record inflation and both stock and bond market declines in 2022. An inverted yield curve and declining manufacturing activity in early 2023. How did we get here, where do we go next and, most importantly - what should investors do?
Turbulence Ahead: Market Review and Outlook
2022 marked one of the most dreadful years for investors in recent memory. Yearly returns for stocks and bonds clocked in at -19% and -13%, respectively, marking the first time since 1969 that both were down on a calendar basis. In 2022, the ongoing battle with inflation dominated both headlines and trends in the market as the Federal Reserve rapidly increased interest rates to slow price increases.
Now with several consecutive months of easing inflation numbers, the Fed appears to be winning the war. However, this happens just as leading indicators suggest substantial economic slowing ahead. Much like a pilot trying to land a jetliner in turbulence, the Fed will move into its final phase of monetary tightening, and we will learn whether officials are able to engineer a smooth slowdown in the economy. While we believe much of the battle is behind us, we still expect turbulence ahead.
Asset Class Returns, 2022 (%)
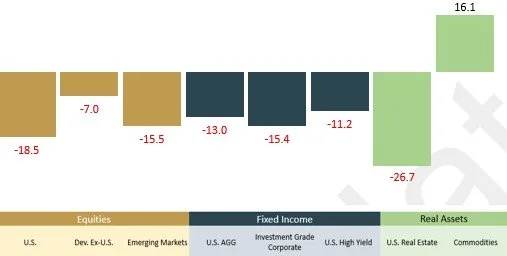
Past performance is not a reliable indicator of current or future results. Indexes are unmanaged and not subject to fees. It is not possible to invest directly in an index. Source: Kestra Investment Management with data from FactSet. Index proxies: Bloomberg U.S. AGG Bond Index, ICE BofA U.S. Corporate, ICE BofA U.S. High Yield, S&P 500, MSCI EM, MSCI EAFE, Dow Jones U.S. Select REIT, Bloomberg Commodity Index. Data as of December 30, 2022.
How Did We Get Here?
Although it appears to have peaked, inflation still sits near record levels. To slow those price increases, the Federal Reserve went on one of the swiftest and sharpest rate tightening cycles in decades, raising the Fed Funds Rate from near zero to above 4% as of mid-January.
Geopolitical risks like war in Ukraine, the European energy crisis, China’s repeated Covid lockdowns, plus a weakening housing market all put pressure on the world economy and aggravated market performance.
Other central banks across the globe have followed the Fed’s lead and started to increase interest rates. Rapid tightening of monetary policy after rates were incredibly low for so long exacerbates already turbulent expectations in 2023.
Where Do We Go Next?
With market turbulence and rising economic uncertainty, we closely monitor the ISM manufacturing index and the treasury yield curve—which have historically proven to be reliable indicators of a pending recession. Both continue to flash warning signs.
Treasury yield curve inversion – When the economy is growing, longer-dated treasury bond yields are typically higher than their short-term counterparts. But before a recession, the curve usually inverts, and long-term bonds begin to yield less than short-term ones, like what we’re seeing today. For instance, the 10-year Treasury yield is about 70 basis points below the 2-year yield, which ranks it near the top of the most severe inversions. The curve first inverted in May of 2022 for the first time since 2008.
ISM Manufacturing Index below 50 – In late 2022, the ISM Manufacturing Index dipped below 50, suggesting that manufacturing activity was beginning to decline. The index's New Orders component, which tends to move in advance of the broader index, has dropped even further. This type of signal often precedes a broader economic recession.
Economic Dashboard
Driven by progressively tighter monetary policy, many leading economic indicators have decelerated rapidly, pointing to tougher conditions ahead for both consumers and businesses in 2023.
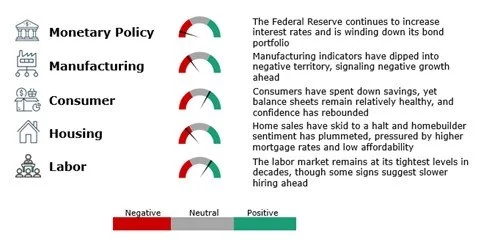
Source: Kestra Investment Management
What Should Investors Do?
Last quarter, we identified two signs to watch for that would help indicate that we were nearing the end of this bear market: slowing inflation and a meaningful decline in earnings expectations.
With four straight months of slower inflation, we are feeling more confident that the hardest part of the Federal Reserve’s job is over. While the Fed is likely to continue raising interest rates this year, the pace and magnitude of those raises will be much less than in 2022.
If the economy falls into recession this year, then earnings estimates are still likely too optimistic. Current estimates suggest that corporate earnings for the S&P 500 will grow by 5%. That number is lower than estimates in June 2022 and the 10-year average growth in earnings – both 9%. But compared to other recessionary periods when earnings fell anywhere from 5% to more than 90%, current projections look too rich.
The good news is that, given the weakness in both stocks and bonds last year, these markets offer much more value than they did just 12 months ago. Stock valuations, for instance, have come off their previously lofty heights. The current price-to-forward earnings ratio on the S&P 500 sits at 17.6x, [MK1] in line with the index’s 20-year average. This suggests that some economic weakening is already baked into stock prices. And yields are much more attractive. The yield on the Bloomberg Aggregate Bond Index is 4.26% now versus 1.76% a year ago.
While we expect more turbulence ahead, investors shouldn’t wait for an all-clear warning before making an investment. Turbulence, like bear markets, often ends well before the pilot signals it’s safe to move around the cabin. Even the best pilots can have bumpy landings if skies are turbulent enough. A well-diversified portfolio can be an investor's best form of a seatbelt.
Invest wisely, live richly.
The opinions expressed in this commentary are those of the author and may not necessarily reflect those held by Kestra Advisor Services Holdings C, Inc., d/b/a Kestra Holdings, and its subsidiaries, including, but not limited to, Kestra Advisory Services, LLC, Kestra Private Wealth Services, LLC, Kestra Investment Services, LLC, Kestra Investment Management, LLC, Bluespring Wealth Partners, LLC, and Grove Point Financial, LLC. The material is for informational purposes only. It represents an assessment of the market environment at a specific point in time and is not intended to be a forecast of future events, or a guarantee of future results. It is not guaranteed by any entity for accuracy, does not purport to be complete and is not intended to be used as a primary basis for investment decisions. It should also not be construed as advice meeting the particular investment needs of any investor. Neither the information presented nor any opinion expressed constitutes a solicitation for the purchase or sale of any security. This material was created to provide accurate and reliable information on the subjects covered but should not be regarded as a complete analysis of these subjects. It is not intended to provide specific legal, tax or other professional advice. The services of an appropriate professional should be sought regarding your individual situation. Kestra Advisor Services Holdings C, Inc., d/b/a Kestra Holdings, and its subsidiaries, including, but not limited to, Kestra Advisory Services, LLC, Kestra Private Wealth Services, LLC, Kestra Investment Services, LLC, Kestra Investment Management, LLC, Bluespring Wealth Partners, LLC, and Grove Point Financial, LLC does not offer tax or legal advice.